Engaged session figures
Engaged session (or ES) figures estimate the likelihood that goals such as purchases, requests, or registration confirmations will be met on the advertised site.
ES statistics have been available since July 14, 2017 for all campaigns that advertise sites with Yandex Metrica tags.
ES indicators
- Engaged sessions (ES)
-
This is the overall session convertability rating from Yandex Direct. This figure represents how interested the users who clicked on your ad are in your product or service.
Machine learning algorithms help Yandex Direct analyze sessions of users that click through on your ad and predict the probability of a conversion on your site. The forecast is based on data about page views, page depth and viewing time.
The convertability of each session is rated in points from 0 to 1. Points for selected sessions are added together. Their total number may be fractional.
- Cost per engaged session (CPES)
-
The average cost of a conversion or the ratio of ad expenditure to session convertability (Expenditure/Engaged sessions).
- Engaged session rate
- The productivity of conversions or the ratio of session convertability to the overall number of clicks on an ad (Engaged sessions/Clicks х 100%).
Usage in campaign analysis
Engaged session figures will help you evaluate the effectiveness of your campaigns if you don't have any goals set in Yandex Metrica or if your goals aren't giving you a clear picture of your campaign results.
If you do use a goal in Yandex Metrica to analyze ad placements, compare the goal data with engaged session figures. If there is traffic in the conversions cross section for a goal, but no traffic displays for engaged sessions (or vice versa), then check your campaign settings, site structure, and the goal you are using to measure productivity.
To find out what ad formats, audiences, sites, and display regions result in the most converted sessions, compare relative indicators — Cost per ES to ES rate (%) in various cross sections.
If you analyze your ES indicators regularly, you will have a better idea of what changes you should make to your campaign or site in order to make your ads more effective.
-
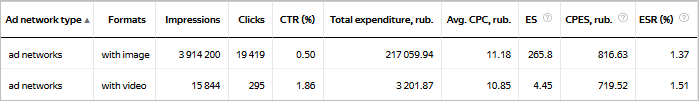
For example, ads display in different formats for network campaigns. Compare your statistics for different formats. Based on your statistics for CPES and ESR (%), you can decide whether your videos are effective in attracting your target audience. You can then set a bid adjustment to raise your bid for ads with videos to increase the likelihood of serving them.
Dashes in a report
You will see dashes in the report columns if:
- The cross-sections you select for the report contain an insufficient number of clicks to determine session convertability. Increase the statistics viewing period or change the grouping of data, cross-sections, or filters.
- You didn't specify a Yandex Metrica tag in your campaign settings.
- You haven't added a Yandex Metrica tag on your site.
- An Ads for Mobile Apps campaign is being analyzed.
- You haven't accumulated enough campaign statistics to calculate a forecast.
