How to work with data
- Scripts for analyzing traffic source sequences
- How to properly export sessions
- How to export hits
- How to match a session with its hits
- “Traffic” report
- “UTM tags” report
- “Popular” report
- “Goal conversion” report
- “Sources, summary” report
- “Ad systems” report
- “E-commerce event funnels” report (not available in the Yandex Metrica interface)
- “Funnels of E-commerce events in different cross-sections” report (not available in the Yandex Metrica interface)
- “Retention of new users” report (not available in the Yandex Metrica interface)
- “Retention of new users in different cross-sections” report (not available in the Yandex Metrica interface).
You can collect non-aggregated data from Yandex Metrica into your ClickHouse cluster deployed in Yandex Cloud.
This integration method has the following distinctions from LogsAPI:
- The integration includes an extended set of fields.
- Unlike in LogsAPI, in sessions, the attribution data is stored in arrays. All
TrafficSource.XXXarrays are intercorrelated based on their attribution type. TheXXXfield in the desiredYYYattribution:TrafficSource.XXX[indexOf(TrafficSource.Model, YYY)] as XXX(see examples of How to properly export sessions). - In sessions,
FirstPartyCookieis equivalent toclientidin LogsAPI.
Scripts for analyzing traffic source sequences
The scripts generate transition chains for each user. As a result, you receive:
- A report on associated conversions from all sources.
- Reports in different attribution models, including those not available in the Yandex Metrica interface (for example, linear attribution model).
Based on this data, you can independently count the most popular traffic source sequences that result in a conversion.
The scripts are published on GitHub.
How to properly export sessions
SELECT
    VisitID,
    CounterID,
    StartDate,
    CounterUserIDHash,  -- Internal UserID used by Yandex Metrica
    FirstPartyCookie, -- Same as ClientID in LogsAPI
    Duration,
    EAction.Type,
    EndURL,
    Goals.ID,
    IsBounce,
    IsMobile,
    OS,
    OSFamily,
    OSName,
    PageViews,
    Referer,
    RegionID,
    StartURL,
    TrafficSource.ID, -- Values in the TrafficSource.ID fields mean the following:
{-1: Internal traffic; 0: Direct traffic;
1: Link traffic; 2: Search engine traffic;
3: Ad traffic; 4: Cached page traffic;
5: Not specified; 6: External links traffic; 7: Mailing traffic;
8: Social network traffic; 9: Clicks from recommendation systems;
10: Clicks from messengers; 11: Clicks by QR code}
    TrafficSource.StrID, -- human-readable name of the traffic source
    TrafficSource.Model, -- all the TrafficSource.XXX arrays are intercorrelated.
The order of items reflects the attribution model from TrafficSource.Model used to calculate the value of the TrafficSource.XXX field while the array stores the TraficSource.XXX value
    TrafficSource.ID[indexOf(TrafficSource.Model, 1)] as last_TraficSourceID, -- Traffic source determined by the Last Click attribution
    TrafficSource.ID[indexOf(TrafficSource.Model, 2)] as last_significant_TraficSourceID, -- Traffic source determined by the Last Non-Direct Click attribution
    TrafficSource.ID[indexOf(TrafficSource.Model, 3)] as first_TraficSourceID, -- Traffic source determined by the First Click attribution
    TrafficSource.ID[indexOf(TrafficSource.Model, 4)] as last_yandex_direct_TraficSourceID,  -- Traffic source determined by the attribution Last Non-Direct Click from Yandex Direct
    TrafficSource.ID[indexOf(TrafficSource.Model, 5)] as cd_last_significant_TraficSourceID, -- Traffic source determined by the attribution Last Non-Direct Click (Cross-Device)
    TrafficSource.ID[indexOf(TrafficSource.Model, 6)] as cd_first_TraficSourceID, -- Traffic source determined by the attribution First Click (Cross-Device)
    TrafficSource.ID[indexOf(TrafficSource.Model, 7)] as cd_last_yandex_direct_TraficSourceID, -- Traffic source determined by the attribution Last Non-Direct Click from Yandex Direct (Cross-Device)

    -- If the traffic source is advertising, you can see which advertising system it originated from.
 An example of the last non-direct traffic source:
    If(last_significant_TraficSourceID = 3, TrafficSource.AdvEnginePlaceStrID[indexOf(TrafficSource.Model, 2)], 'not_ad') as last_significant_adv_engine_id,
    -- If the traffic source is a search engine, you can look up the search engine's name.
An example of the last non-direct traffic source:
    If(last_significant_TraficSourceID = 2, TrafficSource.SearchEngineStrID[indexOf(TrafficSource.Model, 2)], 'not_search') as last_significant_search_engine_id,
    -- Similarly, you can query other traffic sources: social networks, recommendation system, and others.
    UserAgent,
    WatchIDs -- A reference to WatchID from hits_all. Hits with IsParameter = 1 wouldn't be included in this column. If this array includes more than 500 hits, the extra ones will overflow
FROM yandex_data_transfer_test.visits_dttql4la13mb206q472r  -- enter your database and session table here
WHERE StartDate = today() - 1 -- enter any date here, for example, StartDate = toDate('2022-02-01') or StartDate = '2022-02-01'
    AND CounterID = toUInt32(24226447)
GROUP BY
    VisitID,
    CounterID,
    StartDate,
    CounterUserIDHash,
    FirstPartyCookie,
    Duration,
    EAction.Type,
    EndURL,
    Goals.ID,
    IsBounce,
    IsMobile,
    OS,
    OSFamily,
    OSName,
    PageViews,
    Referer,
    RegionID,
    StartURL,
    TrafficSource.Model,
    TrafficSource.ID,
    TrafficSource.StrID,
    last_TraficSourceID,
    last_significant_TraficSourceID,
    first_TraficSourceID,
    last_yandex_direct_TraficSourceID,
    cd_last_significant_TraficSourceID,
    cd_first_TraficSourceID,
    cd_last_yandex_direct_TraficSourceID,
    last_significant_adv_engine_id,
    last_significant_search_engine_id,
    UserAgent,
    WatchIDs
HAVING sum(Sign) = 1
limit 1000- Sessions may update retrospectively, for example, when matching offline conversions.
- When you enable integration, for the earliest sessions,sum(Sign)might turn out to be inconsistent.
- What happens if you omitsum(Sign)
-
The connector's logs store non-collapsed session versions (that is, multiple versions of the same session). If you don't collapse them, the data will be inconsistent, and the same session (its older versions) will be counted more than once.
This happens because when a session is updated, the old version (
VisitVersion = 1,Sign = 1) is not deleted. A row almost identical to the old version is added instead, with the only difference being theSignflag (VisitVersion = 1,Sign = -1). After that, the updated session version is added with a positiveSign(VisitVersion = 2,Sign = 1). As a result, when yougroup bythe relevant fields,sum(Sign)gives you an accurate and valid session count by “collapsing” outdated versions (Sign = 1andSign = -1will be zero).Example of an uncollapsed session in session logsselect VisitID, VisitVersion, Sign FROM yandex_data_transfer_test.visits_dttql4la13mb206q472r -- enter your database and session table here where StartDate = today()-3 -- enter any date here AND (CounterID = toUInt32(24226447)) -- enter your tag ID here and VisitID in (select VisitID from yandex_data_transfer_test.visits_dttql4la13mb206q472r -- enter your database and session table here where StartDate = today()-3 -- enter any date here group by VisitID having count(distinct VisitVersion) > 3 -- for illustrative purposes, we'll take a session that was modified more than three times (you can use any number) order by VisitID desc limit 1 -- for illustrative purposes, we'll take one session (you can take more) ) order by VisitID, VisitVersion, Sign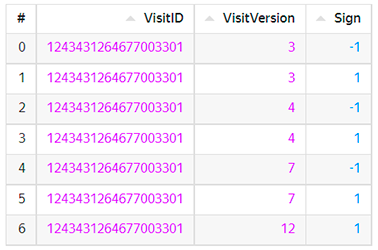 Example with proper collapsing
select VisitID, sum(Sign) as visits FROM yandex_data_transfer_test.visits_dttql4la13mb206q472r -- enter your database and session table here where StartDate = today()-3 -- enter any date here AND (CounterID = toUInt32(24226447)) -- enter your tag ID here and VisitID = 1243431264677003301 group by VisitID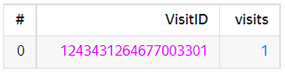 Example of collapsing using final clause after the table name
finalhandles the table in such a way that the versions are already collapsed. It removes redundant session versions on its own. This method is much slower than counting with group by andsum(Sign).select VisitID, VisitVersion, Sign FROM yandex_data_transfer_test.visits_dttql4la13mb206q472r final -- enter your database and session table here where StartDate = today()-3 -- enter any date here AND (CounterID = toUInt32(24226447)) and VisitID = 1243431264677003301 order by VisitID, VisitVersion, Sign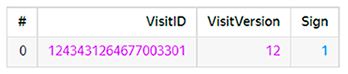
How to export hits
select CounterID,
        EventDate,
        CounterUserIDHash, -- internal UserID used by Yandex Metrica
        FirstPartyCookie, -- same as ClientID in LogsAPI
        UTCEventTime,
        WatchID,
        Referer,
        OriginalURL,  -- unlike OriginalURL, URL may be truncated
        URL,
        UTMSource,
        IsMobile,
        OS,
        OSFamily,
        OSName,
        FirstPartyCookie,
        IsArtifical,
        IsDownload,
        IsLink,
        IsNotBounce,
        IsPageView,
        IsParameter
from yandex_data_transfer_test.hits_dttql4la13mb206q472r -- enter your database and session table here
where EventDate = today()-1 -- enter any date here
   and CounterID = 24226447 -- enter your tag ID here
How to match a session with its hits
To match a VisitID with its hits (WatchID), the WatchIDs column alone may not be enough. This is because the WatchID field doesn't include sessions' parameter hits. You can compile a list of hits within the session manually. For this, you need the session's start date, end date, and the user ID.
select VisitID, -- this select will have sessions with a compiled array of its hits
        CounterUserIDHash,
        UTCStartTime,
        Duration,
        UTCEndTime,
        groupArray(WatchID) as `watchids.id`,
        groupArray(IsPageView) as `watchids.is_page_view`,
        groupArray(IsParameter) as `watchids.is_parameter`,
        groupArray(UTCEventTime) as `watchids.is_utc_event_time`
from ( -- this select will have sessions expanded for each hit
select VisitID,
        a.CounterUserIDHash as CounterUserIDHash,
        UTCStartTime,
        Duration,
        UTCEndTime,
        WatchID,
        IsPageView,
        IsParameter,
        UTCEventTime
from
(select -- get sessions, the user, and the session's start and end dates. The session may continue to update retrospectively!
    VisitID,
    CounterUserIDHash,
    UTCStartTime,
    Duration,
    toDateTime(UTCStartTime) + Duration as UTCEndTime
from yandex_data_transfer_test.visits_dttql4la13mb206q472r final
where StartDate = '2023-04-01'
) as a
left join
(select -- get hits, the user, and the hit's date and time. Hits do not update retrospectively
    WatchID,
    CounterUserIDHash,
    IsPageView,
    IsParameter,
    UTCEventTime
from yandex_data_transfer_test.hits_dttql4la13mb206q472r
where EventDate >= '2023-04-01'
        and EventDate <= toDate('2023-04-01')+5
        ) as b
on a.CounterUserIDHash = b.CounterUserIDHash -- it is important to go by exactly this user ID
where UTCEventTime >= UTCStartTime and -- hits with the time no earlier than the session's start time
        UTCEventTime <= UTCEndTime -- hits with the time no later than the session's end time
order by CounterUserIDHash, UTCEventTime
)
group by VisitID,
        CounterUserIDHash,
        UTCStartTime,
        Duration,
        UTCEndTime
limit 100
“Traffic” report
SELECT StartDate AS `ym:s:date`,
        sum(Sign) AS `ym:s:visits` -- properly collapse multiple session versions into the latest and most relevant one and count the number of sessions
from yandex_data_transfer_test.visits_dttql4la13mb206q472r -- enter your database and session table here
as `default.visits_all`
WHERE `ym:s:date` >= toDate('2023-01-31') -- getting historical data for the period preceding the connector creation is not supported in this version
        and `ym:s:date` <= toDate('2023-02-06') -- data for "today" (and slow updates for more recent days, e.g., offline conversions) may arrive late relative to the interface
        and CounterID = 24226447 -- replace with your tag ID
GROUP BY `ym:s:date`
WITH TOTALS
HAVING `ym:s:visits` >= 0.0
ORDER BY `ym:s:date` ASC
limit 0,7SELECT
toDate(StartDate) AS `ym:s:datePeriodday`,
sum(Sign) AS `ym:s:visits`,
uniqExact(CounterUserIDHash) AS `ym:s:users`,
sum(PageViews * Sign) AS `ym:s:pageviews`,
uniqExactIf(CounterUserIDHash, (`TrafficSource.StartTime`[indexOf(`TrafficSource.Model`, 3)]) = (`TrafficSource.StartTime`[indexOf(`TrafficSource.Model`, 1)])) / uniqExact(CounterUserIDHash) * 100. AS `ym:s:percentNewVisitors`, -- attribution 3 is the First Session attribution, 1 is the Last Session attribution
100. * (sum(IsBounce * Sign) / `ym:s:visits`) AS `ym:s:bounceRate`,
`ym:s:pageviews` / `ym:s:visits` AS `ym:s:pageDepth`,
sum(Duration * Sign) / `ym:s:visits` AS `ym:s:avgVisitDurationSeconds`
-- the metrics “Percentage of robots” and “Cross-device users” are not available in the connector
FROM yandex_data_transfer_test.visits_dttql4la13mb206q472r -- enter your database and session table here
AS `default.visits_all`
WHERE (StartDate >= toDate('2023-03-10'))
AND (StartDate <= toDate('2023-03-16'))
AND (CounterID = toUInt32(24226447)) -- replace with your tag ID
GROUP BY `ym:s:datePeriodday`
WITH TOTALS
HAVING (`ym:s:visits` > 0.) OR (`ym:s:users` > 0.) OR (`ym:s:pageviews` > 0.)
ORDER BY `ym:s:datePeriodday` DESC
LIMIT 0, 50“UTM tags” report
SELECT
    `TrafficSource.UTMSource`[indexOf(`TrafficSource.Model`, 2)] AS `ym:s:lastSignUTMSource`,
    sum(Sign) AS `ym:s:visits`,
    least(uniqExact(CounterUserIDHash), `ym:s:visits`) AS `ym:s:users`,
    100. * (sum(IsBounce * Sign) / `ym:s:visits`) AS `ym:s:bounceRate`,
    sum(PageViews * Sign) / `ym:s:visits` AS `ym:s:pageDepth`,
    sum(Duration * Sign) / `ym:s:visits` AS `ym:s:avgVisitDurationSeconds`,
    sumArray(arrayMap(x -> (if(isFinite(x), x, 0) * Sign), arrayMap(x_0 -> toInt64(notEmpty(x_0)), `EPurchase.ID`))) AS `ym:s:ecommercePurchases`
FROM yandex_data_transfer_test.visits_dttql4la13mb206q472r  -- enter your database and session table here
WHERE (StartDate >= toDate('2023-03-10'))
        AND (StartDate <= toDate('2023-03-16'))
        AND (CounterID = 24226447) -- enter your tag ID here
        AND (`ym:s:lastSignUTMSource` != '')
GROUP BY `ym:s:lastSignUTMSource`
HAVING (`ym:s:visits` > 0.) OR (`ym:s:users` > 0.) OR (`ym:s:ecommercePurchases` > 0.)
ORDER BY
    `ym:s:visits` DESC,
    `ym:s:lastSignUTMSource` ASC
LIMIT 0, 50
“Popular” report
SELECT
    URLHash(URL, toInt8(0)) AS `ym:pv:URLPathLevel1Hash`,
    anyHeavyIf(domain(URL), domain(URL) != '') AS `ym:pv:URLPathLevel1HashFavicon`,
    max(URLHierarchy(ifNull(URL, ''))[1]) AS `ym:pv:URLPathLevel1`,
    count() AS `ym:pv:pageviews`,
    least(uniq(CounterUserIDHash), `ym:pv:pageviews`) AS `ym:pv:users`
FROM yandex_data_transfer_test.hits_dttql4la13mb206q472r AS `default.hits_all`
WHERE (EventDate >= toDate('2023-03-10'))
        AND (EventDate <= toDate('2023-03-16'))
        and CounterID = 24226447 -- enter your tag ID here
       and IsPageView
GROUP BY `ym:pv:URLPathLevel1Hash`
    WITH TOTALS
ORDER BY
    `ym:pv:pageviews` DESC,
    `ym:pv:URLPathLevel1` ASC,
    `ym:pv:URLPathLevel1Hash` ASC
LIMIT 0, 50
“Goal conversion” report
WITH 1. AS W, 17069575 as my_goal_id -- replace with your goal ID
SELECT
 toDate(StartDate) AS `ym:s:datePeriodday`,
    100. * (sum(has(`Goals.ID`, my_goal_id) * (Sign * W)) / sum(Sign * W)) AS `ym:s:goal17069575conversionRate`,
    sum(arrayCount(x -> (my_goal_id = x), `Goals.ID`) * (Sign * W)) AS `ym:s:goal17069575reaches`,
    sumIf(Sign * W, arrayExists(x_0 -> (x_0 = my_goal_id), `Goals.ID`)) AS `ym:s:goal17069575visits`,
    least(toFloat64(uniqIf(CounterUserIDHash, arrayExists(x_0 -> (x_0 = my_goal_id), `Goals.ID`))), `ym:s:goal17069575visits`) AS `ym:s:goal17069575users`,
    sumIf(PageViews * (Sign * W), arrayExists(x_0 -> (x_0 = my_goal_id), `Goals.ID`)) AS `ym:s:goal17069575pageviews`,
    (least(uniqIf(CounterUserIDHash, ((`TrafficSource.StartTime`[indexOf(`TrafficSource.Model`, 3)]) = (`TrafficSource.StartTime`[indexOf(`TrafficSource.Model`, 1)])) AND arrayExists(x_0 -> (x_0 = my_goal_id), `Goals.ID`)), uniqIf(CounterUserIDHash, arrayExists(x_0 -> (x_0 = my_goal_id), `Goals.ID`))) / uniqIf(CounterUserIDHash, arrayExists(x_0 -> (x_0 = my_goal_id), `Goals.ID`))) * 100. AS `ym:s:goal17069575percentNewVisitors`,
    100. * (sumIf(IsBounce * (Sign * W), arrayExists(x_0 -> (x_0 = my_goal_id), `Goals.ID`)) / `ym:s:goal17069575visits`) AS `ym:s:goal17069575bounceRate`,
    `ym:s:goal17069575pageviews` / `ym:s:goal17069575visits` AS `ym:s:goal17069575pageDepth`,
    sumIf(Duration * (Sign * W), arrayExists(x_0 -> (x_0 = my_goal_id), `Goals.ID`)) / `ym:s:goal17069575visits` AS `ym:s:goal17069575avgVisitDurationSeconds`
FROM yandex_data_transfer_test.visits_dttql4la13mb206q472r -- enter your database and session table here
WHERE (StartDate >= toDate('2023-02-18'))
        AND (StartDate <= toDate('2023-03-17'))
        AND (CounterID = 24226447) -- replace with your tag ID
GROUP BY `ym:s:datePeriodday`
HAVING (`ym:s:goal17069575reaches` > 0.) AND ((`ym:s:goal17069575reaches` > 0.) OR (`ym:s:goal17069575visits` > 0.) OR (`ym:s:goal17069575users` > 0.) OR (`ym:s:goal17069575pageviews` > 0.))
ORDER BY `ym:s:datePeriodday` DESC
LIMIT 0, 50
“Sources, summary” report
WITH 1. AS W
SELECT
    `TrafficSource.ID`[indexOf(`TrafficSource.Model`, 2)] AS `ym:s:lastSignTrafficSource`,
    sum(Sign * W) AS `ym:s:visits`,
    least(toFloat64(uniq(CounterUserIDHash)), `ym:s:visits`) AS `ym:s:users`,
    100. * (sum(IsBounce * (Sign * W)) / `ym:s:visits`) AS `ym:s:bounceRate`,
    sum(PageViews * (Sign * W)) / `ym:s:visits` AS `ym:s:pageDepth`,
    sum(Duration * (Sign * W)) / `ym:s:visits` AS `ym:s:avgVisitDurationSeconds`
from yandex_data_transfer_test.visits_dttql4la13mb206q472r -- enter your database and session table here
WHERE (StartDate >= toDate('2023-03-10'))
        AND (StartDate <= toDate('2023-03-16'))
        AND (CounterID = 24226447) -- replace with your tag ID
GROUP BY `ym:s:lastSignTrafficSource`
    WITH TOTALS
HAVING (`ym:s:visits` > 0.) OR (`ym:s:users` > 0.)
ORDER BY
    `ym:s:visits` DESC,
    `ym:s:lastSignTrafficSource` ASC
LIMIT 0, 50WITH 1. AS W
SELECT
`TrafficSource.ID`[indexOf(`TrafficSource.Model`, 2)] AS `ym:s:lastSignTrafficSource`,
`TrafficSource.StrID`[indexOf(`TrafficSource.Model`, 2)] AS `ym:s:lastSignTrafficSourceName`,
if(
((`TrafficSource.Domain`[indexOf(`TrafficSource.Model`, 2)]) != '') AND
(`ym:s:lastSignTrafficSource` IN (-1, toInt8(1))),
`TrafficSource.Domain`[indexOf(`TrafficSource.Model`, 2)],
if(`ym:s:lastSignTrafficSource` = toInt8(2),
`TrafficSource.SearchEngineStrID`[indexOf(`TrafficSource.Model`, 2)],
if(`ym:s:lastSignTrafficSource` = toInt8(3), `TrafficSource.AdvEnginePlaceStrID`[indexOf(`TrafficSource.Model`, 2)],
if(`ym:s:lastSignTrafficSource` = toInt8(8), toString(`TrafficSource.SocialSourceNetworkStrID`[indexOf(`TrafficSource.Model`, 2)]),
if(`ym:s:lastSignTrafficSource` = toInt8(9), toString(if((`TrafficSource.RecommendationSystemID`[indexOf(`TrafficSource.Model`, 2)]) = 0, '1', `TrafficSource.RecommendationSystemStrID`[indexOf(`TrafficSource.Model`, 2)])),
if(`ym:s:lastSignTrafficSource` = toInt8(10), toString(if((`TrafficSource.MessengerID`[indexOf(`TrafficSource.Model`, 2)]) = 0, '1', `TrafficSource.MessengerStrID`[indexOf(`TrafficSource.Model`, 2)])),
if(`ym:s:lastSignTrafficSource` = toInt8(11), toString(`TrafficSource.QRCodeProviderStrID`[indexOf(`TrafficSource.Model`, 2)]),
''
)
)
)
)
)
)
) AS `ym:s:lastSignSourceEngine`,
anyHeavy(if(`ym:s:lastSignTrafficSource` IN (-1, toInt8(1)), concatAssumeInjective('http://', `TrafficSource.Domain`[indexOf(`TrafficSource.Model`, 2)]), '')) AS `ym:s:lastSignSourceEngineURL`,
sum(Sign * W) AS `ym:s:visits`,
least(toFloat64(uniqExact(CounterUserIDHash)), `ym:s:visits`) AS `ym:s:users`,
100. * (sum(IsBounce * (Sign * W)) / `ym:s:visits`) AS `ym:s:bounceRate`,
sum(PageViews * (Sign * W)) / `ym:s:visits` AS `ym:s:pageDepth`,
sum(Duration * (Sign * W)) / `ym:s:visits` AS `ym:s:avgVisitDurationSeconds`
FROM yandex_data_transfer_test.visits_dttql4la13mb206q472r -- enter your database and session table here
WHERE (StartDate >= toDate('2023-03-10'))
and (StartDate >= toDate('2023-03-16'))
AND (CounterID = 24226447) -- replace with your tag ID
GROUP BY
`ym:s:lastSignTrafficSource`,
`ym:s:lastSignTrafficSourceName`,
`ym:s:lastSignSourceEngine`
WITH TOTALS
HAVING (`ym:s:visits` > 0.) OR (`ym:s:users` > 0.)
ORDER BY
`ym:s:visits` DESC,
`ym:s:lastSignTrafficSource` ASC,
`ym:s:lastSignSourceEngine` ASC
LIMIT 0, 50“Ad systems” report
WITH 1. AS W
SELECT
    `TrafficSource.AdvEnginePlaceStrID`[indexOf(`TrafficSource.Model`, 2)] as `ym:s:lastSignAdvEngine`, -- Ad system attributed by the Last Non-Direct Click
    sum(Sign * W) AS `ym:s:visits`,
    least(toFloat64(uniqExact(CounterUserIDHash)), `ym:s:visits`) AS `ym:s:users`,
    100. * (sum(IsBounce * (Sign * W)) / `ym:s:visits`) AS `ym:s:bounceRate`,
    sum(PageViews * (Sign * W)) / `ym:s:visits` AS `ym:s:pageDepth`,
    sum(Duration * (Sign * W)) / `ym:s:visits` AS `ym:s:avgVisitDurationSeconds`
from yandex_data_transfer_test.visits_dttql4la13mb206q472r -- enter your database and session table here
WHERE (StartDate = toDate('2023-03-15'))
        AND (CounterID = 24226447) -- replace with your tag ID
        AND (`ym:s:lastSignAdvEngine` != '')
        AND ((`TrafficSource.ID`[indexOf(`TrafficSource.Model`, 2)]) = toInt8(3)) -- traffic source is Advertising, determined by the Last Non-Direct Click attribution model
GROUP BY `ym:s:lastSignAdvEngine`
    WITH TOTALS
HAVING (`ym:s:visits` > 0.) OR (`ym:s:users` > 0.)
ORDER BY
    `ym:s:visits` DESC,
    `ym:s:lastSignAdvEngine` ASC
LIMIT 0, 50
“E-commerce event funnels” report (not available in the Yandex Metrica interface)
The integration allows you to build more sophisticated reports that are not available in Yandex Metrica. For example, you can build a funnel of E-commerce events.
We recommend that you meet the following conditions for this report:
- The
detail,add, andpurchaseevents are set up and passed correctly. - You have at least 10 users per cross-section.
- The conversion rate for the first step is more than 1%.
- You have sufficient data for cross-sections, provided you use them (see the report on funnels of E-commerce events in different cross-sections).
select counter_id,
        step0_users, -- total number of users
        step1_users, -- users who viewed products
        step2_users, -- users who viewed products and added them to the shopping cart
        step3_users, -- users who viewed products, added them to the shopping cart,
 and made a purchase
        round(step0_users/step0_users*100, 4) as perc_step0, -- percentage of the total number of users
        round(step1_users/step0_users*100, 4) as perc_step1, -- percentage of users who viewed products
        round(step2_users/step0_users*100, 4) as perc_step2, -- percentage of users who viewed products and added them to the shopping cart
        round(step3_users/step0_users*100, 4) as perc_step3 -- percentage of users who viewed products, added them to the shopping cart, and made a purchase

from

(select
        counter_id,
        sum(step_1) as step1_users,
        sum(step_2) as step2_users,
        sum(step_3) as step3_users
    from
        (select
            CounterID as counter_id,
            CounterUserIDHash as user_id,
            max(e.Type = 1) as step_1, -- only viewing products
            sequenceMatch('(?1)(?2)')(e.EventTime, (e.Type = 1), (e.Type = 4)) as step_2, -- viewing products and adding them to the shopping cart
            sequenceMatch('(?1)(?2)(?3)')(e.EventTime, (e.Type = 1), (e.Type = 4), (e.Type = 3)) as step_3 -- viewing products, adding them to the shopping cart, and making a purchase
        from
            (select
                CounterUserIDHash,
                CounterID,
                e.Type, -- types of E-commerce events (1 - detail, 2 - cart state, 3 - purchase, 4 - adding to cart, 5 - removing from cart)
                e.EventTime
            from yandex_data_transfer_test.visits_dttql4la13mb206q472r final  -- enter your database and session table here
            array join EAction as e --arrayJoin expands the array with E-commerce events into distinct rows
            where (StartDate >= '2023-02-01')
                and (StartDate <= '2023-02-28')
                and CounterID = 24226447 -- replace with your tag ID
                )
        group by counter_id, user_id
        )
    group by counter_id) as a

inner join (select
        CounterID as counter_id,
        uniqExact(CounterUserIDHash) as step0_users
    from yandex_data_transfer_test.visits_dttql4la13mb206q472r final  -- enter your database and session table here
    where (StartDate >= '2023-02-01')
        and (StartDate <= '2023-02-28')
        and CounterID = 24226447 -- replace with your tag ID
    group by counter_id) as b
on a.counter_id = b.counter_id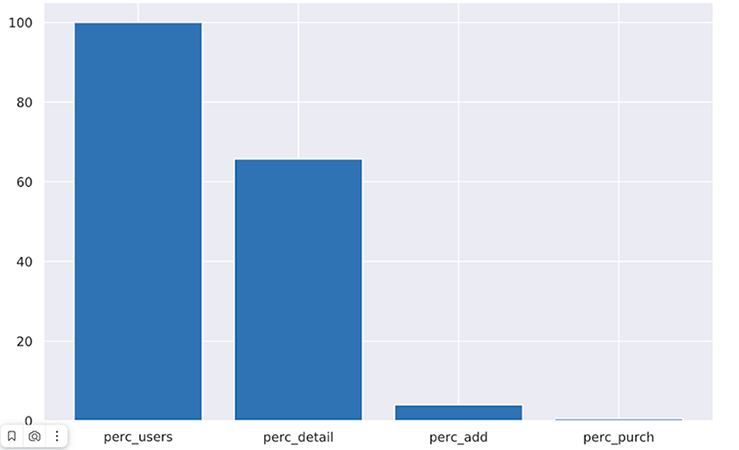
“Funnels of E-commerce events in different cross-sections” report (not available in the Yandex Metrica interface)
You can also build a funnel by various cross-sections: traffic source, operating system, device.select counter_id,
is_mobile,
step0_users, -- total number of users
step1_users, -- users who viewed products
step2_users, -- users who viewed products and added them to the shopping cart
step3_users, -- users who viewed products, added them to the shopping cart, and made a purchase
round(step0_users/step0_users*100, 4) as perc_step0, -- percentage of the total number of users
round(step1_users/step0_users*100, 4) as perc_step1, -- percentage of users who viewed products
round(step2_users/step0_users*100, 4) as perc_step2, -- percentage of users who viewed products and added them to the shopping cart
round(step3_users/step0_users*100, 4) as perc_step3 -- percentage of users who viewed products, added them to the shopping cart, and made a purchase
from
(select
counter_id,
is_mobile,
sum(step_1) as step1_users,
sum(step_2) as step2_users,
sum(step_3) as step3_users
from
(select
CounterID as counter_id,
CounterUserIDHash as user_id,
is_mobile,
max(e.Type = 1) as step_1, -- only viewing products
sequenceMatch('(?1)(?2)')(e.EventTime, (e.Type = 1), (e.Type = 4)) as step_2, -- viewing products and adding them to the shopping cart
sequenceMatch('(?1)(?2)(?3)')(e.EventTime, (e.Type = 1), (e.Type = 4), (e.Type = 3)) as step_3 -- viewing products, adding them to the shopping cart, and making a purchase
from
(select
CounterUserIDHash,
CounterID,
IsMobile as is_mobile,
e.Type, -- types of E-commerce events (1 - detail, 2 - cart state, 3 - purchasing, 4 - adding to cart, 5 - removing from cart)
e.EventTime
from yandex_data_transfer_test.visits_dttql4la13mb206q472r final -- enter your database and session table here
array join EAction as e --arrayJoin expands the array with e-commerce events into distinct rows
where (StartDate >= '2023-02-01')
and (StartDate <= '2023-02-28')
and CounterID = 24226447 -- replace with your tag ID
)
group by counter_id, user_id, is_mobile
)
group by counter_id, is_mobile) as a
inner join (select
CounterID as counter_id,
IsMobile as is_mobile,
uniqExact(CounterUserIDHash) as step0_users
from yandex_data_transfer_test.visits_dttql4la13mb206q472r final -- enter your database and session table here
where (StartDate >= '2023-02-01')
and (StartDate <= '2023-02-28')
and CounterID = 24226447 -- replace with your tag ID
group by counter_id, is_mobile) as b
on a.counter_id = b.counter_id and a.is_mobile = b.is_mobile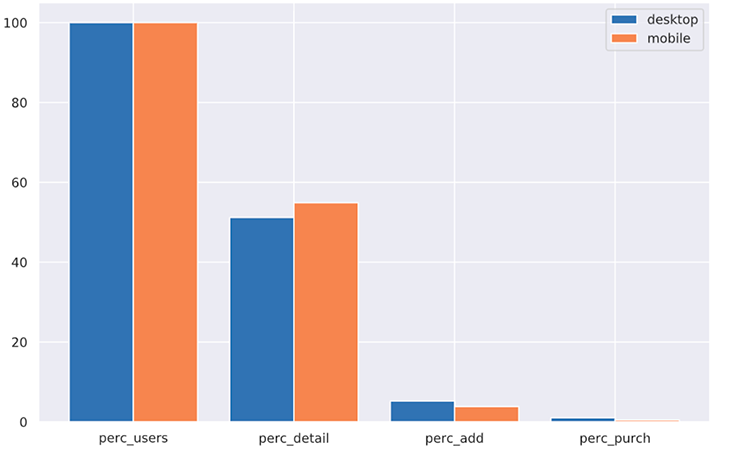
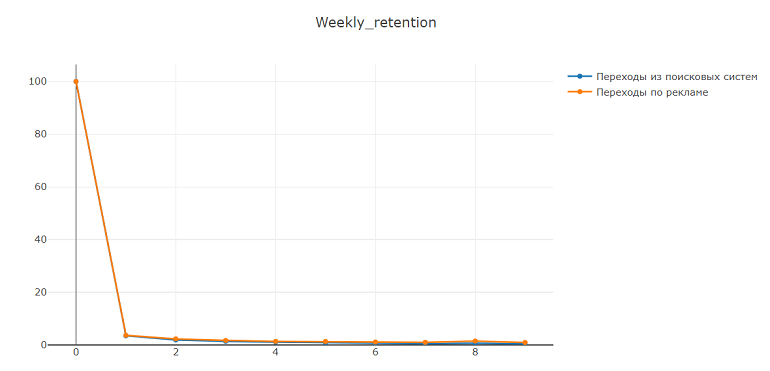
“Retention of new users” report (not available in the Yandex Metrica interface)
with main as

(select
        counter_id,
        num_week,
        uniq(user_id) as users
from
    (select
        CounterUserIDHash as user_id,
        CounterID as counter_id,
        toDate(FirstVisit) as first_date, -- user's first session on the site
        StartDate as event_date,
        (toMonday(event_date) - toMonday(first_date))/7 as num_week
    from yandex_data_transfer_test.visits_dttql4la13mb206q472r final -- enter your database and session table here
    where event_date >= '2022-12-01' -- 15-week window
        and event_date <= toDate('2022-12-31') + 92 -- 15-week window
        and first_date >= '2022-12-01' -- get only the new users who first visited the site in December
        and first_date <= '2022-12-31' -- get only the new users who first visited the site in December
        and counter_id = 24226447 -- replace with your tag ID
    )
group by
    counter_id,
    num_week
order by num_week)

select counter_id,
        a.users as users,
        b.users as users_first_week,
        round(a.users/b.users*100, 4) as perc_retention
from main as a
inner join (select * from main where num_week = 0) as b
on a.counter_id = b.counter_id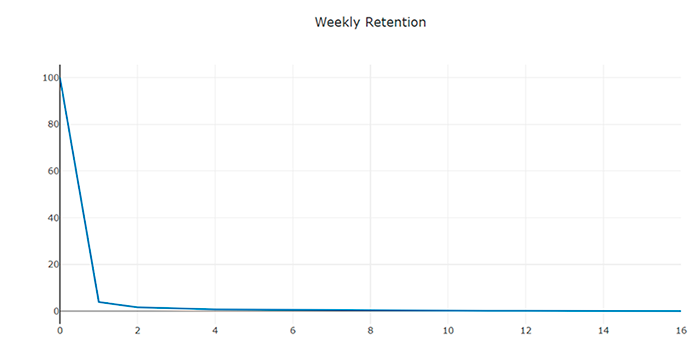
“Retention of new users in different cross-sections” report (not available in the Yandex Metrica interface).
You can also add a cross-section and compare user retention across different cross-sections. We recommend that the cross-section include at least 30 users and represent at least 5% of the total user base.with main as
(select
counter_id,
param,
num_week,
uniq(user_id) as users
from
(select
CounterUserIDHash as user_id,
CounterID as counter_id,
toDate(FirstVisit) as first_date, -- user's first session on the site
StartDate as event_date,
(toMonday(event_date) - toMonday(first_date))/7 as num_week,
TrafficSource.ID[indexOf(TrafficSource.Model, 3)] as param
from yandex_data_transfer_test.visits_dttql4la13mb206q472r -- enter your database and session table here
where event_date >= '2022-12-01' -- 15-week window
and event_date <= toDate('2022-12-31') + 92 -- 15-week window
and first_date >= '2022-12-01' -- get only the new users
who first visited the site in December
and first_date <= '2022-12-31' -- get only the new users
who first visited the site in December
and counter_id = 24226447 -- replace with your tag ID
)
group by
counter_id,
param,
num_week,
param
order by param, num_week)
select counter_id,
param,
a.users as users,
b.users as users_first_week,
round(a.users/b.users*100, 4) as perc_retention
from main as a
inner join (select * from main where num_week = 0) as b
on a.counter_id = b.counter_id and a.param = b.param