Checking the tag
- Step 1. Making sure the tag is placed on the site
- Step 2. Checking data collection
- Step 3. Checking statistics display
- What data is available in the debug panel
- What data is available in the browser console when using the browser console
- Questions and answers
After creating and adding the tag snippet to the site, you can make sure it is placed on the site pages and works correctly.
Step 1. Making sure the tag is placed on the site
- Go to Yandex Metrica and find the tag you want to check in the list.
- Go to Settings, then Check for tag.
- In the field, specify the URL of the page you want to make sure the tag is placed on. For example, https://example.com/page/. By default, the field displays the URL of the most viewed page over the past 30 days.
Yandex Metrica will start searching the page you specified for the tag whose settings you are viewing. It will open in a new browser tab. If Yandex Metrica finds the tag, a message confirming the tag is placed on the website will appear on the page.
- Common reasons why Yandex Metrica couldn't find a tag
-
Reason Recommendation The tag snippet loads with a delay or the tag loads after performing a specific action on the site. Wait a while or perform the action that should trigger the tag to load. The tag is blocked by the Adblock Plus extension, other scripts, or firewall. Open the browser console to check if the “Adblock Plus” extension or other scripts are running. The tag isn't installed on the site page, is installed incorrectly, or was removed from the page. Make sure the tag is installed correctly using the special parameter from step 2 below. Reason Recommendation The tag snippet loads with a delay or the tag loads after performing a specific action on the site. Wait a while or perform the action that should trigger the tag to load. The tag is blocked by the Adblock Plus extension, other scripts, or firewall. Open the browser console to check if the “Adblock Plus” extension or other scripts are running. The tag isn't installed on the site page, is installed incorrectly, or was removed from the page. Make sure the tag is installed correctly using the special parameter from step 2 below.
Step 2. Checking data collection
To see what data the tag collects:
- Append the ym_debug=2 parameter to the page URL in the browser's address bar and reload the page.
http://example.com/?_ym_debug=2 At the bottom of the page, click
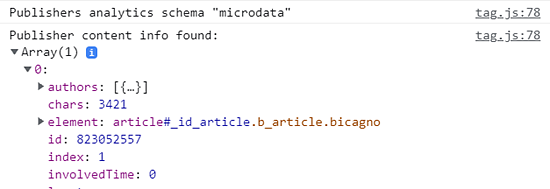
 . The debug panel appears. Look at the Counters tab.Note. The _ym_debug=2 parameter only works if the new Yandex Metrica code snippet is installed on the website. If you have an older version of the code snippet or the debug panel doesn't appear, use the browser console.
If the tab displays information about the tag number and settings, it means that the tag is working correctly.
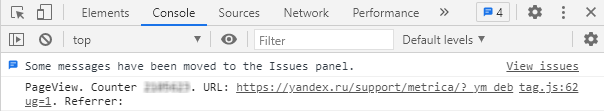
Information about actions performed on the website, such as viewing the page (PageView), is available on the Console tab.
For ease of navigation when switching between different data for a particular tag, click
 . This way, Yandex Metrica remembers the changes you've made if you open a new tab.
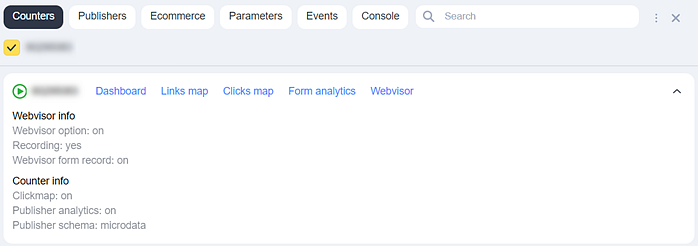
You can also log your actions when working with the debugger.
To close the debugger, open the additional settings  and click Close debugger. You can also close the debugger by adding ?_ym_debug=0 to the page URL.
- Append the ym_debug=2 parameter to the page URL in the browser's address bar and reload the page.
http://example.com/?_ym_debug=2 - Open the browser console with the keyboard shortcut Ctrl + Shift + J (⌥ + ⌘ + J for Apple OS).
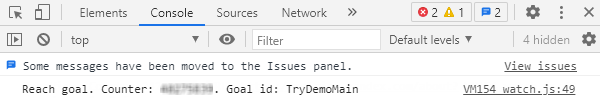
If the console displays information about the tag number and the action on the page (for example, PageView), then the tag is working correctly. See what other events may be displayed in the browser console.
Use this method if your website has an older version of the Yandex Metrica tag.
- Reasons why data is missing in the console
-
Reason Recommendation The tag is blocked by the Adblock Plus extension, other scripts, or firewall. Open the browser console to check if the “Adblock Plus” extension or other scripts are running. The tag isn't installed on the site or is installed incorrectly. For example, the CMS modified the code snippet. Reinstall the tag or contact your CMS support service. The mc.yandex.ru domain is blocked in the hosts file on your OS. Check your OS settings. Reason Recommendation The tag is blocked by the Adblock Plus extension, other scripts, or firewall. Open the browser console to check if the “Adblock Plus” extension or other scripts are running. The tag isn't installed on the site or is installed incorrectly. For example, the CMS modified the code snippet. Reinstall the tag or contact your CMS support service. The mc.yandex.ru domain is blocked in the hosts file on your OS. Check your OS settings.
To solve the issue, please contact the person responsible for maintaining the website.
Step 3. Checking statistics display
To see how many users visit the site page where you confirmed the tag is present, go to Yandex Metrica, select Settings, and perform step 3 under Check for tag: open the Popular report. The segment for viewing the URL you specified will be configured in the report.
Information may be missing in the report if the specified site page had no visitors for the selected period. If there is data in the browser console and you are sure that users visit the page, but the report isn't displayed, check the tag settings in the Filters tab:
- If the filters are too strict, you can remove the ones you don't need.
- If Don't count my sessions is set as a filter, try opening the site in your browser in “Incognito mode”.
What data is available in the debug panel
When checking a tag, you can switch between the following tabs:
Shows information about the tag installed on a page.
What data is available in the browser console when using the browser console
When checking the tag, you may see the following data in the browser console:
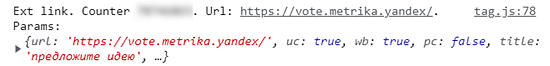
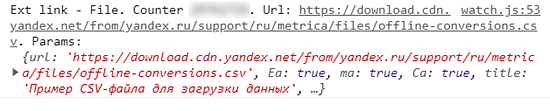
- Product views — Displays a string that looks like Params. Counter <tag number>. Params: {"__ym":{"ecommerce":[{"detail":{"products":[{"id":"111","name":"","price":,"category":""}]}}]}}. For example:

- Adding an item to the basket: Displays the string that looks like Params. Counter <tag number>. Params: {"__ym":{"ecommerce":[{"add":{"products":[{"id":"111","name":"","price":,"category":""}]}}]}}.
- Purchase — Displays the string that looks like Params. Counter <tag number>. Params: {"__ym":{"ecommerce":[{"purchase":{"products":[{"id":"111","name":"","price":,"category":""}]}}]}}.
- Removing an item from the basket: Displays a string that looks like Params. Counter <tag number>. Params: {"__ym":{"ecommerce":[{"remove":{"products":[{"id":"111","name":"","price":,"category":""}]}}]}}.
For more information about setting up events and viewing statistics, see What is E-commerce?.

Questions and answers
- If metrics have dropped, does this mean the tag isn't working?
- There are various reasons why statistics may drop. To make sure the tag is working, check it (on the main and other pages of the site). To find out why metrics have dropped:
- Look at the statistics page by page, for example, in the Popular report.
- Determine from which sources the number of visits have lowered. It may be because of the traffic-attracting channels.
